PARENTAL QUESTIONNAIRE

Every March (below showing March 2026), we send out a parental questionnaire, asking parents to share their thoughts and opinions about Shamblehurst Primary School.

The data from these questionnaires is used to guide school improvement priorities for the next academic year and beyond.

The results of this questionnaire are below:
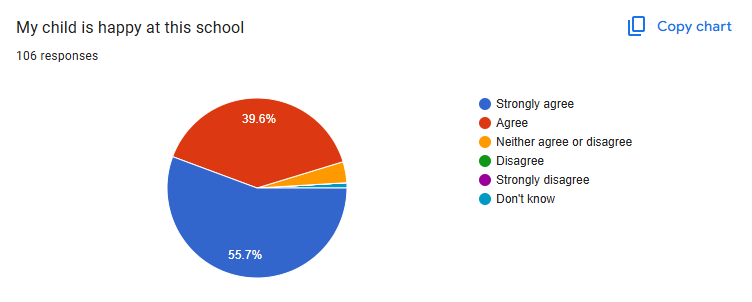
Pie chart showing survey responses about children's happiness at school, with 55.7% strongly agree, 39.6% agree, small percentages for neither, disagree, strongly disagree, and don't know.
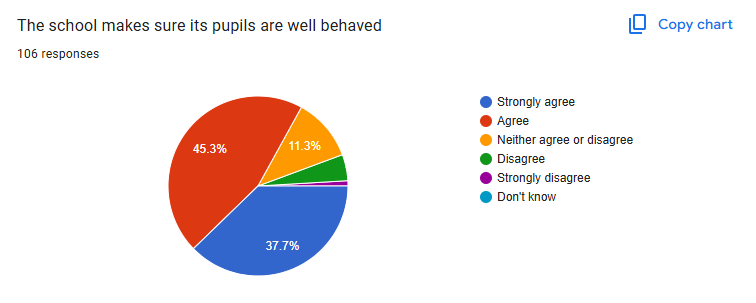
Pie chart showing responses about school making sure pupils are well behaved, with categories: Strongly agree, Agree, Neither agree or disagree, Disagree, Strongly disagree, Don't know. The chart indicates the percentages for each response.
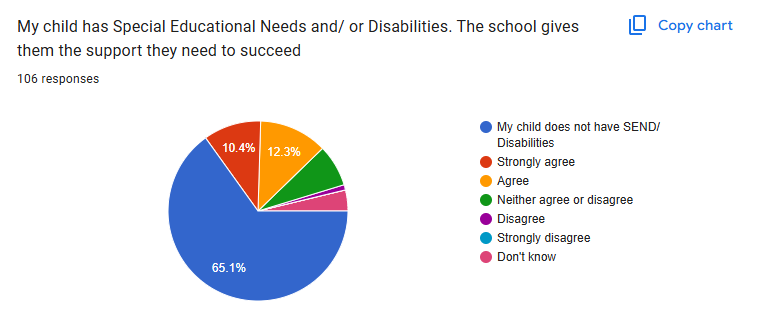
Pie chart showing responses to the statement: "My child has Special Educational Needs and/or Disabilities. The school gives them the support they need to succeed." The chart indicates 65.1% of respondents agree that the school provides necessary support, 12.3% strongly agree, 10.4% disagree, and the remaining responses include strongly disagree, neither agree nor disagree, and don't know.
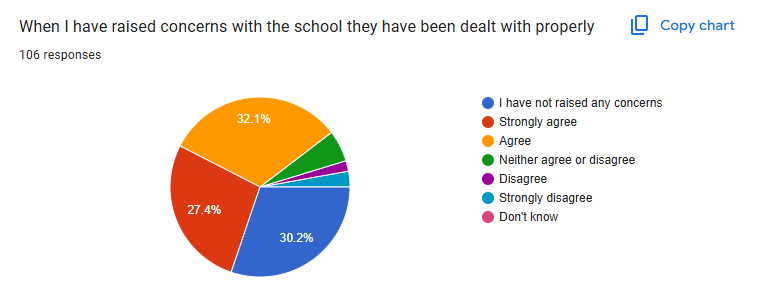
Pie chart showing responses to a survey question about concerns with the school. The chart includes categories: I have not raised any concerns, Strongly agree, Agree, Neither agree or disagree, Disagree, Strongly disagree, and Don't know, with respective percentages.
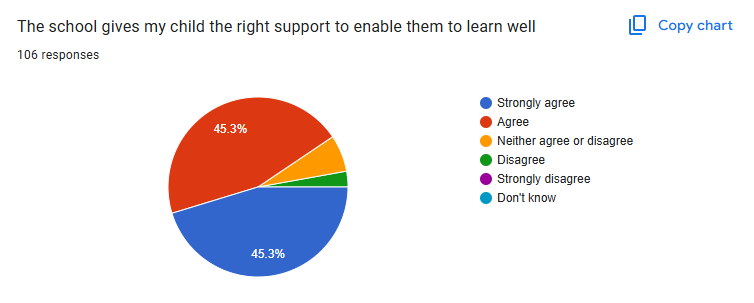
Pie chart showing responses to the statement 'The school gives my child the right support to enable them to learn well,' with 45.3% strongly agree, 45.3% agree, 4.7% neither agree nor disagree, small percentage disagree, very small percentage strongly disagree, and very small percentage don't know.
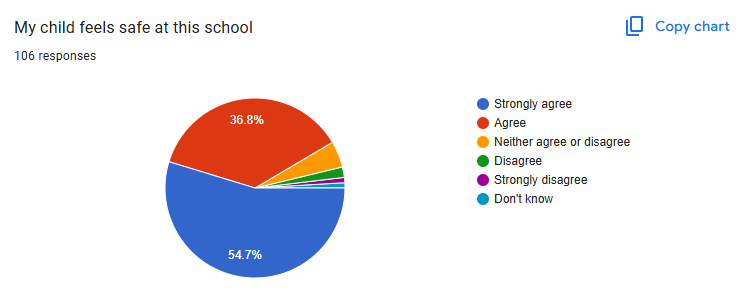
Pie chart showing responses to the statement 'My child feels safe at this school' with options: Strongly agree, Agree, Neither agree or disagree, Disagree, Strongly disagree, Don't know.
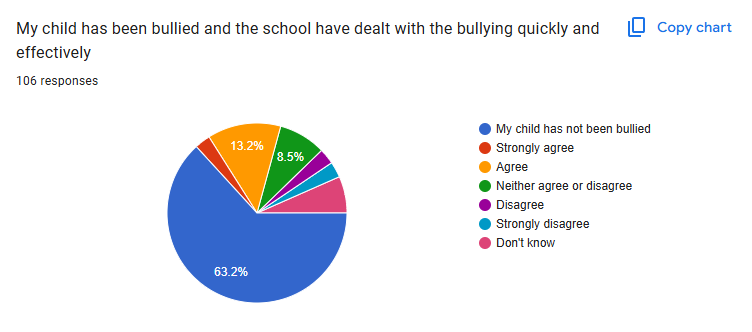
Pie chart displaying responses to whether a school has dealt with bullying effectively, based on 106 responses. The chart shows 63.2% agree, 13.2% strongly agree, 8.5% neither agree nor disagree, with smaller percentages for other responses.
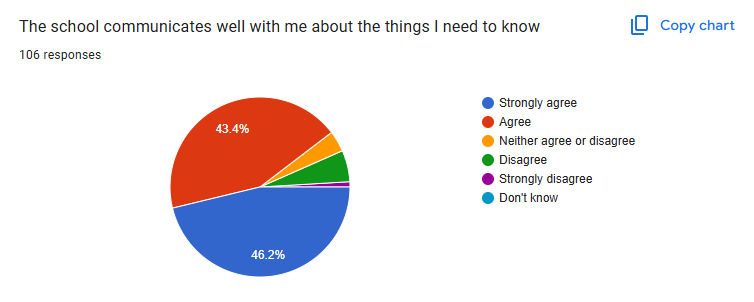
Pie chart showing survey responses about school communication. 46.2% strongly agree, 43.4% agree, smaller percentages for neutral, disagree, strongly disagree, and don't know.
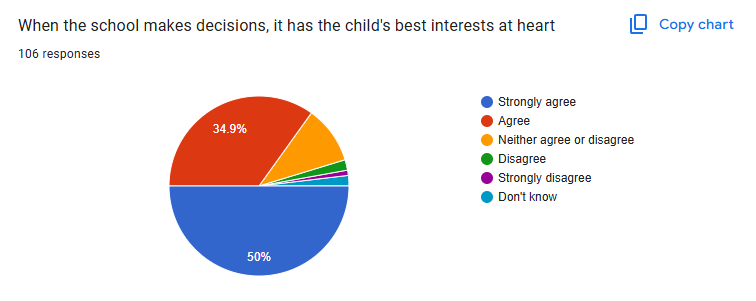
Pie chart showing responses to the statement: 'When the school makes decisions, it has the child's best interests at heart.' The chart indicates 50% strongly agree, approximately 35% agree, with smaller percentages for other responses.
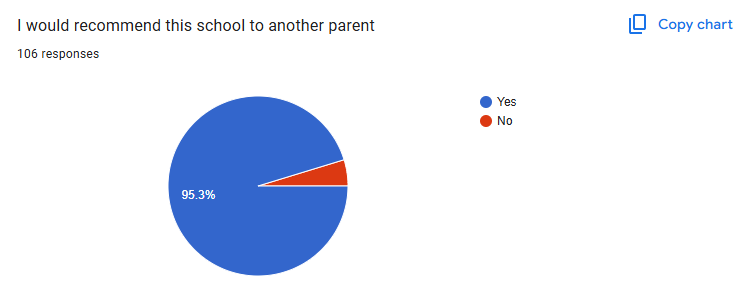
Pie chart showing 106 responses to whether they would recommend the school to another parent, with 95.3% Yes and a small percentage No.